Then you need a sensor system that:
- Can measure the parameters you want to measure
- Can display the values in real time
- Can store anything measured
- Can make all data available for analysis
- Can notify when something is out of the ordinary
- Can measure also when the power is out
3 main components
A sensor system consists of three main components:
1. The sensors
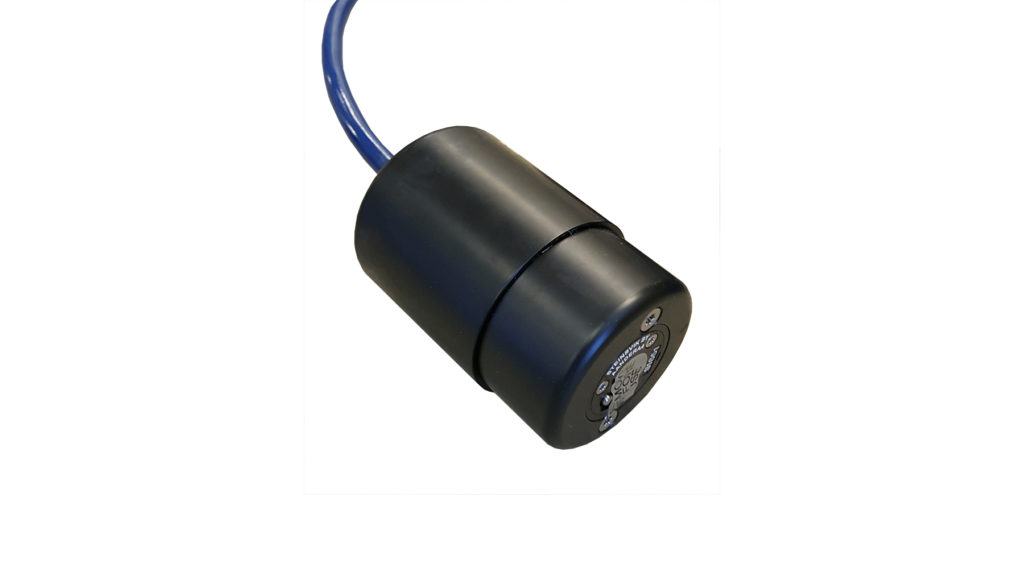
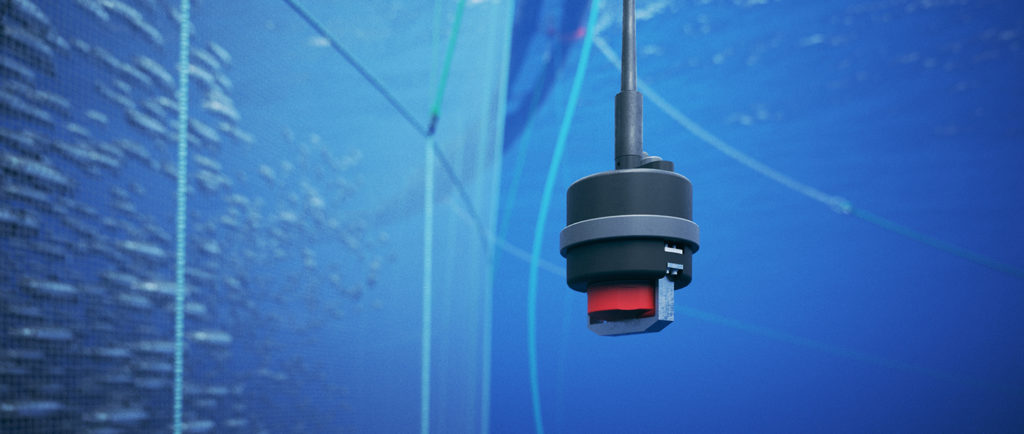
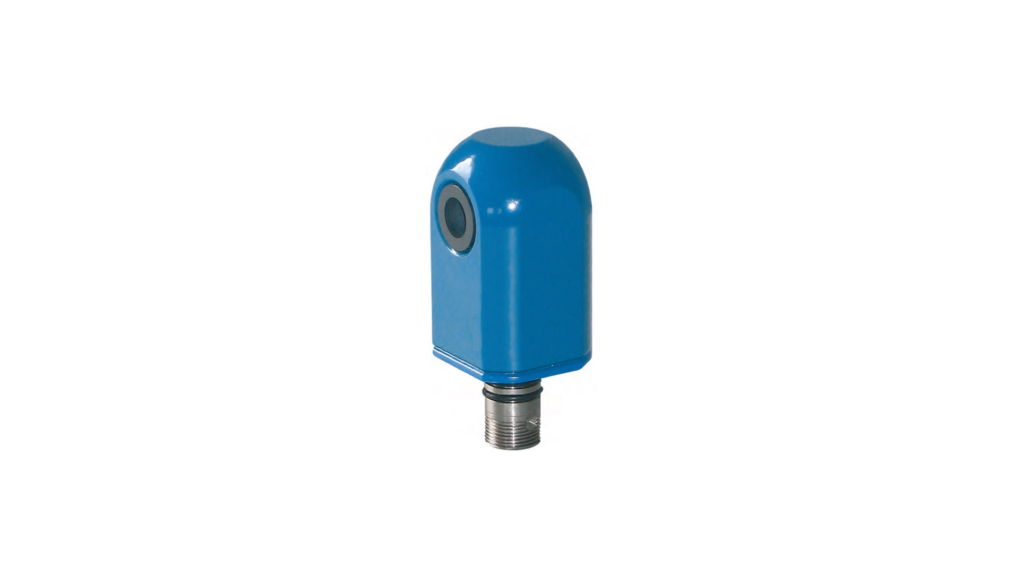
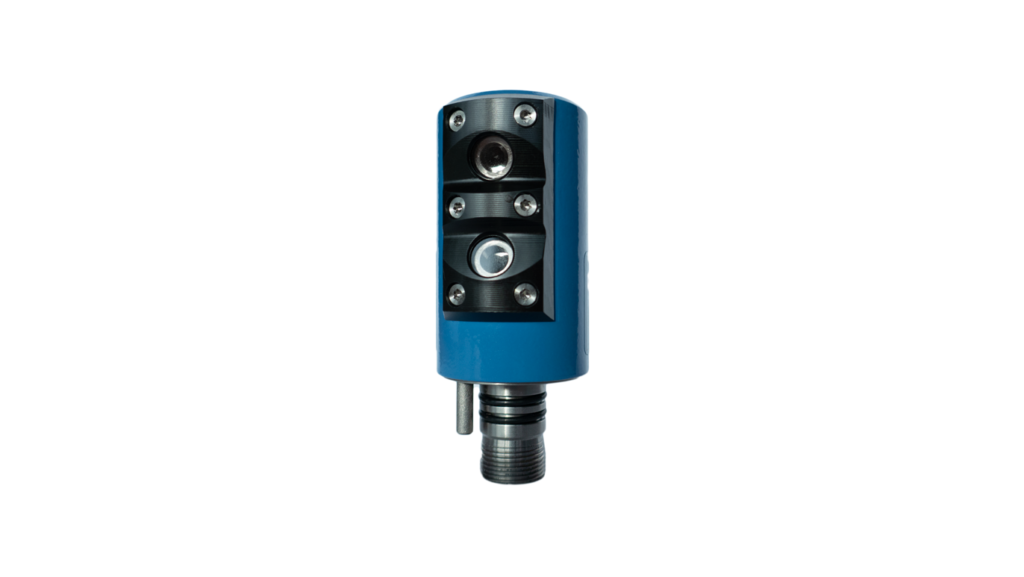
Depending on what you want to monitor, we offer sensors that are either built into our underwater cameras or are free-standing for use in or outside the pens. These can be single sensors or multisensors / sensor stations.
- Oxygen
- Temperature
- Salinity
- Conductivity
- Sea current (magnitude and direction)
- Turbidity
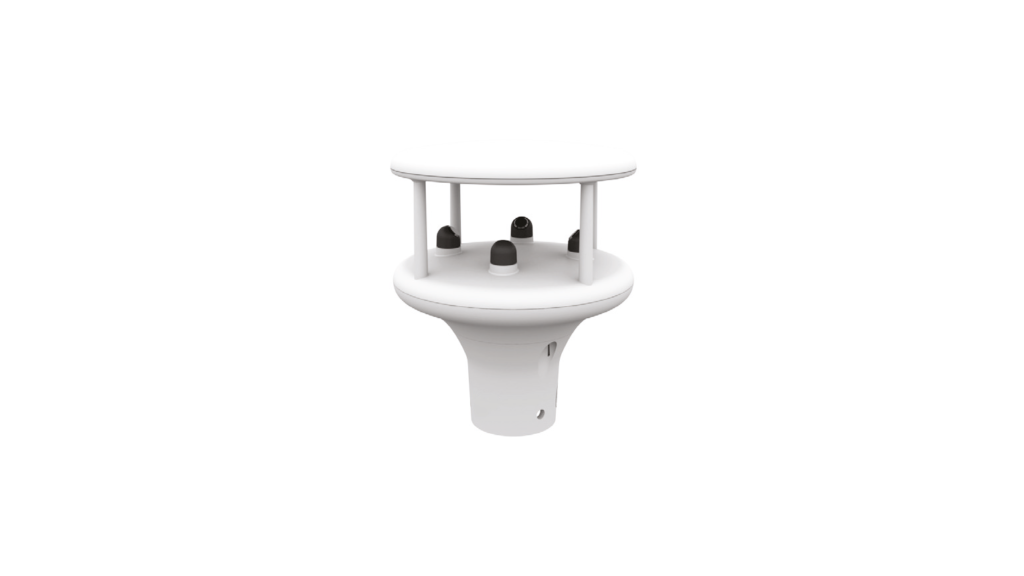
- Weather (weather station)
2. Infrastructure
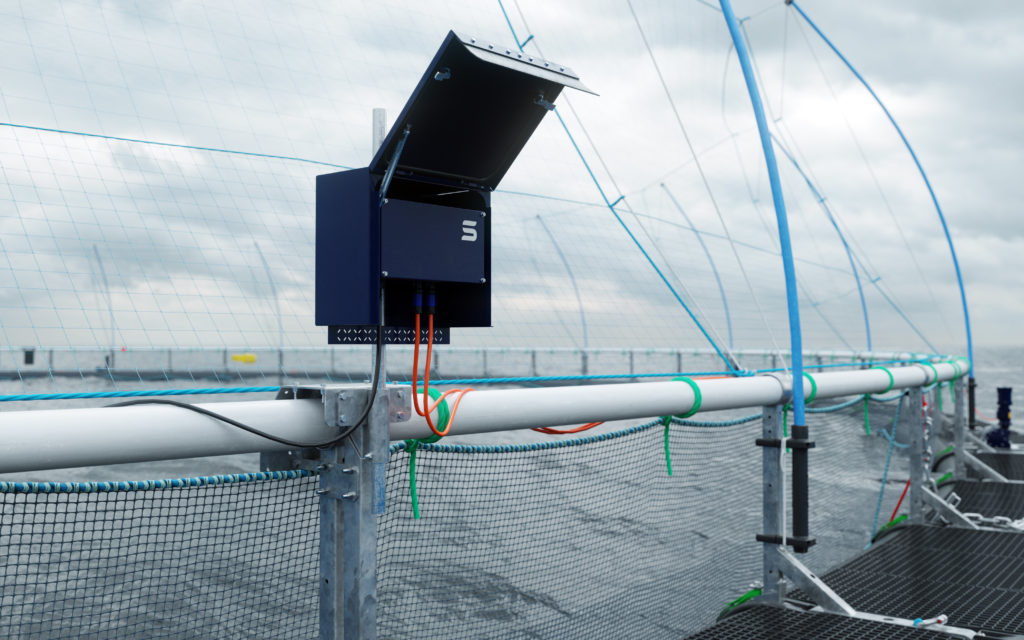
The values measured by each sensor must be robustly transmitted from pen to feeding barge or feed center. ScaleAQ has various solutions for this, so that the infrastructure can be adapted to local needs. For example, if you have our camera solutions, we use existing cables and power cabinets. We can also transmit sensor data wirelessly from pen to barge, and optionally further than the barge if the barge does not have a stable network. There are no restrictions on the number of sensors you can place per pen.
3. Visualization, storage and analysis
The measured values must be displayed in real time, stored and retrieved for analysis and comparison. For sensors built into our cameras, oxygen and temperature may be displayed in the camera image, allowing the operator to see the measured values where the biomass is located. We also have a dashboard that can display all metrics in real time and that alerts the operator if any values are out of the ordinary. In addition, all sensor measurements are stored in a secure cloud solution, and thus all environmental parameters will be available for analysis and comparison of pen against pen, site against site, region against region.
